Acc 529 - Accounting for Managerial Decision Making
Essay by review • November 28, 2010 • Case Study • 5,270 Words (22 Pages) • 1,694 Views
Essay Preview: Acc 529 - Accounting for Managerial Decision Making
Home
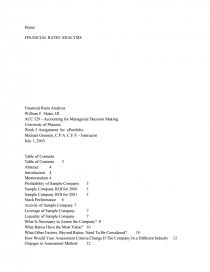
FINANCIAL RATIO ANALYSIS
Financial Ratio Analysis
William F. Slater, III
ACC 529 - Accounting for Managerial Decision Making
University of Phoenix
Week 5 Assignment for ePortfolio
Michael Greenen, C.P.A, C.F.P. - Instructor
July 1, 2003
Table of Contents
Table of Contents 3
Abstract 4
Introduction 4
Memorandum 4
Profitability of Sample Company 5
Sample Company ROI for 2000 5
Sample Company ROI for 2001 5
Stock Performance 6
Activity of Sample Company 7
Leverage of Sample Company 7
Liquidity of Sample Company 7
What Is Necessary to Assess the Company? 8
What Ratios Have the Most Value? 10
What Other Factors, Beyond Ratios, Need To Be Considered? 10
How Would Your Assessment Criteria Change If The Company In a Different Industry 12
Changes in Assessment Method 12
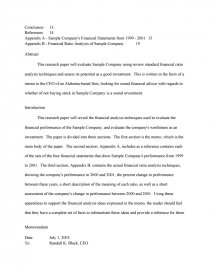
Conclusion 13
References 14
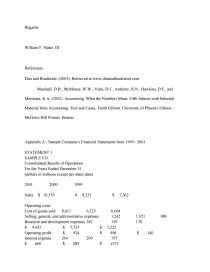
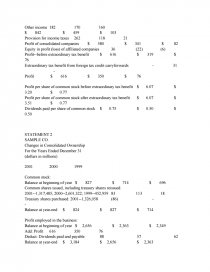
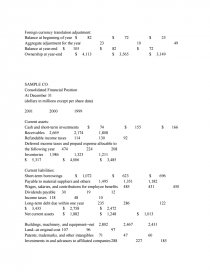
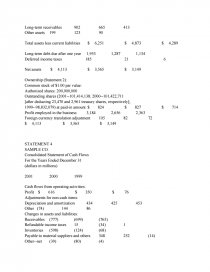
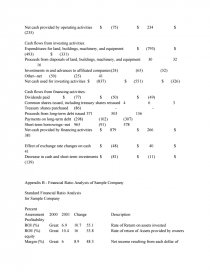
Appendix A - Sample Company's Financial Statements from 1999 - 2001 15
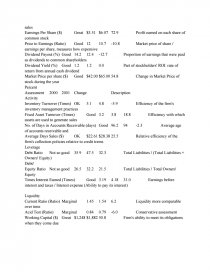
Appendix B - Financial Ratio Analysis of Sample Company 19
Abstract
This research paper will evaluate Sample Company using review standard financial ratio analysis techniques and assess its potential as a good investment. This is written in the form of a memo to the CEO of an Alabama-based firm, looking for sound financial advice with regards to whether of not buying stock in Sample Company is a sound investment.
Introduction
This research paper will reveal the financial analysis techniques used to evaluate the financial performance of the Sample Company, and evaluate the company's worthiness as an investment. The paper is divided into three sections. The first section is the memo, which is the main body of the paper. The second section, Appendix A, includes as a reference contains each of the sets of the four financial statements that show Sample Company's performance from 1999 to 2001. The third section, Appendix B, contains the actual financial ratio analysis techniques, showing the company's performance in 2000 and 2001, the percent change in performance between these years, a short description of the meaning of each ratio, as well as a short assessment of the company's change in performance between 2000 and 2001. Using these appendices to support the financial analysis ideas expressed in the memo, the reader should feel that they have a complete set of facts to substantiate these ideas and provide a reference for them.
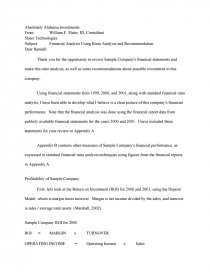
Memorandum
Date: July 1, 2003
To: Randall K. Black, CEO
Absolutely Alabama Investments
From: William F. Slater, III, Consultant
Slater Technologies
Subject: Financial Analysis Using Ratio Analysis and Recommendation
Dear Randall:
Thank you for the opportunity to review Sample Company's financial statements and make this ratio analysis, as well as some recommendations about possible investment in this company.
Using financial statements from 1999, 2000, and 2001, along with standard financial ratio analysis, I have been able to develop what I believe is a clear picture of this company's financial performance. Note that the financial analysis was done using the financial report data from publicly available financial statements for the years 2000 and 2001. I have included these statements for your review in Appendix A
Appendix B contains other measures of Sample Company's financial performance, as expressed in standard financial ratio analysis techniques using figures from the financial reports in Appendix A.
Profitability of Sample Company
First, let's look at the Return on Investment (ROI) for 2000 and 2001, using the Dupont Model, which is margin times turnover. Margin is net income divided by the sales, and turnover is sales / average total assets (Marshall, 2002).
Sample Company ROI for 2000
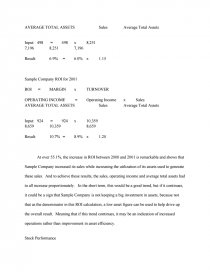
ROI = MARGIN x TURNOVER
OPERATING INCOME = Operating Income x Sales
AVERAGE TOTAL ASSETS Sales Average Total Assets
Input: 498 = 498 x 8,251
7,196 8,251 7,196
...
...
